|
|
||
|
|
FORUM:
|
||||||||||||||||||||||||||||||||||||||||||||||||||||||||||||||||||||||||||||||||||||||||||||||||||||||||||||||||||||||||||||||||||||||||||||||||||||||||||||||||||||||||||||||||||||||||||||||||||||||||||||||||||||||||||||||||||||||||||||||||||||||
Navigating the Currents of HistoryMark Ciotola |
||||||||||||||||||||||||||||||||||||||||||||||||||||||||||||||||||||||||||||||||||||||||||||||||||||||||||||||||||||||||||||||||||||||||||||||||||||||||||||||||||||||||||||||||||||||||||||||||||||||||||||||||||||||||||||||||||||||||||||||||||||||
|
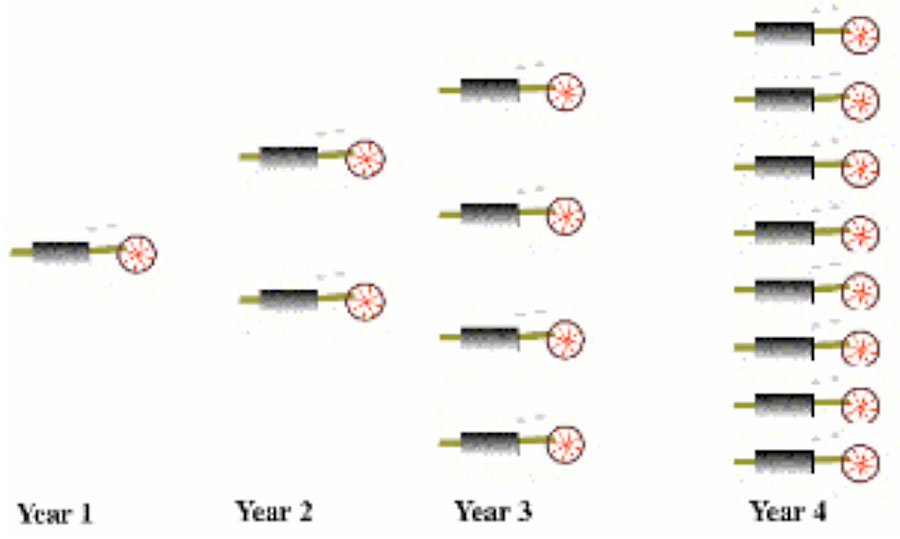
Introduction and Context This paper provides a conceptual framework for analyzing history by utilizing the concepts of emergence and emergent structures. It first applies this framework to social-economic structures involving physical resources such as gold and petroleum and then to macro-historical structures such as dynasties. History is a grand field encompassing all the activities and artifacts of recorded humanity. Physics is also a grand field that ultimately constrains, and possibly drives, human activities and the formation of artifacts. Physics can go deeper than mere, empirical computations by using characterizations and principles that allow for a unified framework of analysis. This paper explores a few approaches to identify and apply unifying principles for some aspects of history, without attempting to overwhelm the evaluation and analysis of history as a humanity. During the approximately 5000 years of recorded human history, we see long-term trends such as the overall exponential increase in human population and advances in technology. While these are certainly important trends for humanity, temporary deviations from trends are even more interesting. These deviations might be the product of regularly occurring tendencies, processes and structures. We see such processes and structures repeatedly arising in world history. Dynasties and empires come and go. Rise-and-fall patterns are also seen in economics and business. We shall explore and investigate whether such deviations share commonalities in their formation and progression. Conceptual Framework We will start by presenting a conceptual framework. Several terms will be presented and related to each other. These terms may sound familiar, but here they may be defined independently of their use in other fields (see Appendix A). These terms are intentionally general, yet pertain to specific types of phenomena. A useful analogy to keep in mind while reading this paper is of water flowing down a river. Storm systems raise water up on to mountains, creating a potential. Gravity pulls the water down from mountain to sea. Sometimes the flow of water gets blocked from logjams and other causes. Complex river channels and other means emerge to breakup or overcome the barriers, and the force is relieved, restoring the system to a form of equilibrium. It has been observed that entropic potential results in the emergence of complex dissipative structures.1 2 3 Where a thermodynamic potential exists, there is substantial evidence that systems tend to configure themselves to maximize their rate of entropy increase. This tendency results in the emergence of structures that consume and dissipate entropic potentials. Atmospheric convection columns allow faster removal of thermal energy from the hot surface of the Earth into the coldness of space. Tornados and hurricanes are even more complex, faster mechanisms. The further a system is removed from equilibrium, the more likely it is for complexity to form into mechanisms to consume potential.4 For example, convective energy transport structures (cells of hot plasma) form in stars as their temperature gradient becomes steeper.5 If a complex structure can perform work, we can call it an engine. Steam engines in electric power plants are a type of engine called a heat engine. A heat engine consumes thermal potential. It produces work that can be used to operate machine tools, pump water or generate electricity. Such work can be called production. Only a portion of the flow of thermal energy can be used to generate work. This proportion is the engine's efficiency, which is the percentage of consumption is transformed into production. Hence, a heat engine also produces waste heat and entropy. A heat engine by itself might not result in faster consumption of potential than a simple conductor. Yet what if the work from a heat engine is used to build additional heat engines? The result will be an exponential increase in the quantity (population) of heat engines (Figure 1). If each reproducing heat engine consumes potential, then there will be an exponential increase in the consumption of potential. Therefore, the emergence of reproducing heat engines is favored by the laws of thermodynamics.
The concept of an engine can be generalized to any mechanism that consumes potential and produces work. Bacteria consume high level energy and produce more bacteria, so they fit within this paradigm. Most living organisms do. Intelligent creatures can figure out additional means to consume thermodynamic potential, so intelligence is favored. The great organizations and technological developments of human civilization can consume potential even faster, through agriculture, trade, vast irrigation works, large coal mines, deep oil drilling and even the release of nuclear energy. Limits and Decreasing Efficiency There will always be factors that limit the growth in a system. A regime that experiences exponential growth will eventually begin to experience such limiting factors. Work on system dynamics such as the Club of Rome's Limits to Growth6 involves attempts to better understand these limiting factors. Such factors restrain growth and sometimes stop it altogether. Limiting factors usually exist due to a shortage of some essential resource or an excess of some "negative" resource. Turning to biotechnology, an examination of reproducing cells shows that the chief limiting factors are typically a nutrient limitation or an accumulation of a toxic metabolite.7 Even in an environment that is overall rich in resources, scaling issues result in the decrease of surface area to volume ratio of the organism colony. Lack of oxygen can be a limiting factor for large cell cultures. The organisms often cannot get access to abundant resources because they are crowded out by their neighboring organisms. Multi-cell organisms attempt to overcome the surface area limitation with structures such as veins and folding. Yet this approach itself has limits. An elephant still faces many challenges as compared with an ant, such as expelling sufficient body heat. Human civilization meets a similar surface area challenge with similar structures. The great freeways and road networks in cities and even across the countryside resemble the blood circulation system in our own bodies. If there is a nonrenewable, built-up potential, such as oil, coal or gold, then generally, the intrinsic efficiency at which each additional unit of consumption is transformed into production decreases. This is expected: we go for the low hanging fruit first, then the slightly higher fruit, and only go for the hard-to-reach fruit at the top of the tree last. There are two chief types of efficiency: intrinsic efficiency and overall efficiency. Intrinsic efficiency is limited by the Second Law of Thermodynamics prohibition on entropy decreasing in an isolated system. Overall efficiency cannot exceed intrinsic efficiency, but it can be much lower. Technical improvements and economies of scale can help improve overall efficiency. Overall efficiency functions can be in several forms, depending on the circumstances involved. For example, for a nonrenewable resource, the efficiency function may decay linearly or exponentially. There are ways of determining the overall efficiency function from actual data or known constraints. The Rise and Fall of A Bubble We have seen how the emergence of reproducing dissipative structures can lead to exponential growth. We have also seen how intrinsic efficiency decreases as a nonrenewable resource is consumed. Hence, we now have the conceptual means to understand the lifecycle of a bubble. To be clear, from this point further, a bubble will refer to a rise-then-fall progression due to the emergence of reproducing, dissipative structures operating upon a limited, nonrenewable resource.
Since exponential growth is involved, but the transformation of consumption into production must be discounted by efficiency, this approach to bubble modeling is called efficiency-discounted exponential growth (EDEG). Application to Natural Resources A bubble can involve physical or social resources. However, it is easier to begin analyzing physical resource bubbles, since there is often more available data and the examples are fairly straightforward. It is instructive to apply this bubble paradigm to a few cases involving natural resources such as fossil fuels or precious metals. Mining is both a physical and social activity. Deposits of a commercially-demanded substance represent an economic potential (which is ultimately a thermodynamic potential). Mined substances are typically nonrenewable. If you extract a ton of that material, another ton does not form in the ground. Such substances took millions or even billions of years to form and accumulate. Therefore, there is only so much to extract: the mining bubble must eventually end. In other words:
at any point of time. Further, since the resource is nonrenewable, the intrinsic efficiency of extracting the potential will tend to decrease over time (according the hypothesis above). It is preferable to examine a case where there is ample data. Ideally, there should be multiple actors, at least at the beginning, so that individual differences average out to clarify the overall pattern. Multiple actors with significant variation provides a system with a flexible "stochastic" capability to allow the system to adapt and progress. San Juan Mountain Area Mining Region. To apply bubble analysis of a mining region, it is best if the region considered is sufficiently large to initially support many actors, such as mining enterprises. Then in early stages, but after things get started, no individual mine can determine the fate of the entire region. For example, poor management at one mine is offset by effective management at another. The region should be sufficiently isolated so as not to be too influenced by external factors, but there must nevertheless be an internal or external demand for the substance. The San Juan mountain area (known as the "San Juans") in southwest Colorado is such a region, and is a suitable physical and social example of a bubble, including the mining society that developed in the region. The San Juans region of Colorado produced gold and silver8 from hundreds of mines, around which towns and communities eventually developed. The San Juans were ruled by Spain until 1848, and then by the United States. Spanish gold mining of placer deposits (pieces of nearly pure gold found on the surface) took place between about 1765-1776. Some U.S. mining took place in 1860, but it was interrupted by U.S. Civil War. At this point, "only the smaller deposits of high-grade ore could be mined profitably." Mining slowly started again in 1869. There were 200 miners by 1870. An Indian Treaty was negotiated in 1873, which removed a major obstacle to an increase of mining.9 10 In 1881, a railroad service was established, resulting in a "decline in ore shipping rates." The regions heydays were between about 1889 and 1900. As the region matured, there was a major consolidation of mining operations as well as significant infrastructure improvements such as rail lines. By 1889, English investors had come to control the major mines. There were also labor troubles. The 1890 production total for San Juans was $1,120,000 in gold; $5,176,000 in silver. The region produced $4,325,000 in gold and $5,377,000 in silver in 1899.11 Note that for mining, production refers to the processed metal rather than mere ore. By 1900, the region began to take on more of the characteristics of a settled community. There was a movement for more "God" and less "red lights." By 1909, "the gilt had eroded", dilapidation set in and the population decreased. World War I caused production to greatly fall, due to decreased demand from Europe, and the region lost workers. Farming became more important to local economy than mining. Silver and gold mining all but ceased by about 1921. Today, there is again mining in miscellaneous minerals, but not much in gold, which was the primary economic driver for the "great days". The region is now used primarily for recreation and some agriculture.12 An EDEG model was generated for the San Juans region and compared with actual mining data (Figure 2).13 Exponential growth was initially facilitated by an increase in the quantity of mines, then later by the growing size of mines. Intrinsic efficiency decline in mining tends to comprise decreasing quality ore. For example, the early-mined placer deposits might comprise 100% gold, while late stage ore might comprise less than 1% gold. The model is somewhat higher than the peak, but parameters were adjusted to provide a better fit with the overall data. Deviations shown in the curve occurred due to both random events, social, economic and logistic "turbulence", business cycles and major external events.
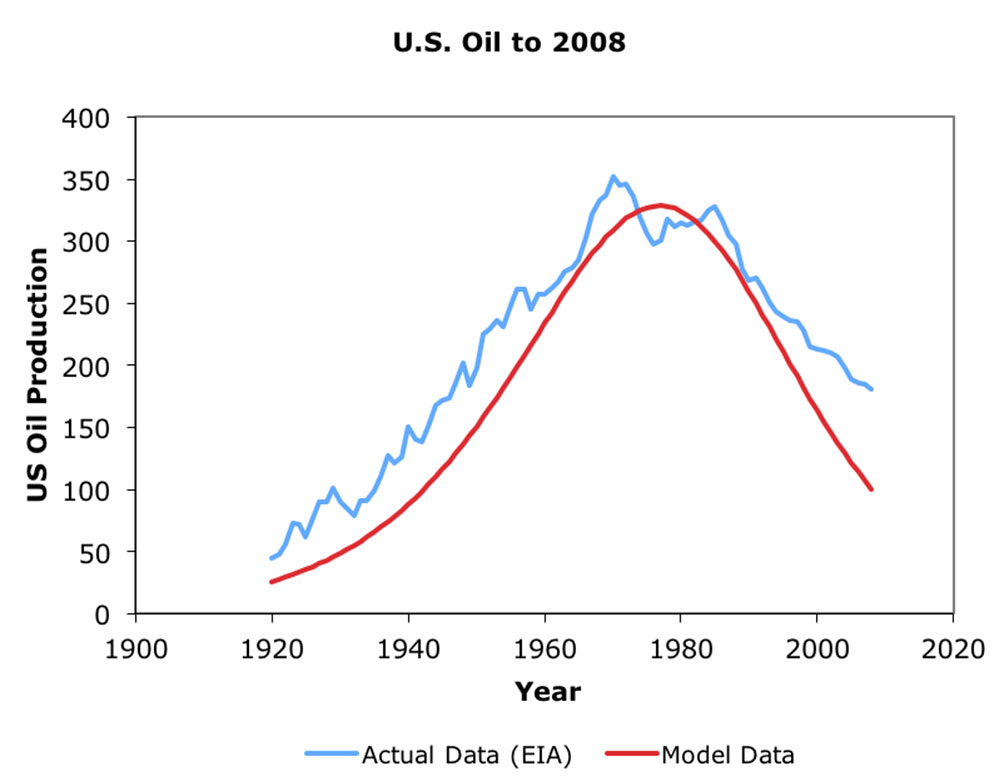
U.S. Petroleum Production. Petroleum (oil) is a mixture of hydrocarbon molecules. The formation of oil is complicated and involves a series of steps and conditions that typically require hundreds of millions of years to complete. First, organic matter from dead plants, animals and plankton falls to the bottom of shallow sea basins. If organic material is deposited at a high rate in large quantities, it will become preserved. Eventually, the deposited matter sinks deeper due to geologic forces as well as the weight of the accumulating matter above it. As the matter sinks thousands of feet under the ground, it becomes hotter and the organic material is literally "cooked". Heat breaks down the organic matter into long hydrocarbon molecules. Eventually oil is formed. 14 15 Hewett-Hubbert (HH) curves are functions that represent the extraction of minerals or petroleum over time for a large region or country. Such curves apparently originated with Donnel Foster Hewett for European metal mining (Hewett, 1929). Such curves were then applied by petroleum geologist M. King Hubbert to U.S. domestic petroleum extraction.16 17 Hewett-Hubbert (HH) curves represent statistical distributions regardless of how they are generated. HH curves generally represent situations where there are a considerable number of actors, such as in the case of regional or national oil or mining production. Efficiency-discounted exponential growth (EDEG) is an approach to generating an HH function.18 An EDEG model was generated for U.S. domestic petroleum extraction (Figure 3; see Appendix for derivation). Actual data exceeds model prior and after peak. Parameters were set to match peak, but could have been adjusted for less error elsewhere at the expense of greater peak error. As oil became more available, the uses and demand for it multiplied, driving and financing an exponential increase in production. That oil wells have had to be drilled increasingly deeper and in unfavorable areas such as at sea is evidence of decreasing intrinsic efficiency. Some of that decrease has been mitigated by improved exploration and drilling technologies as well as industry consolidation.
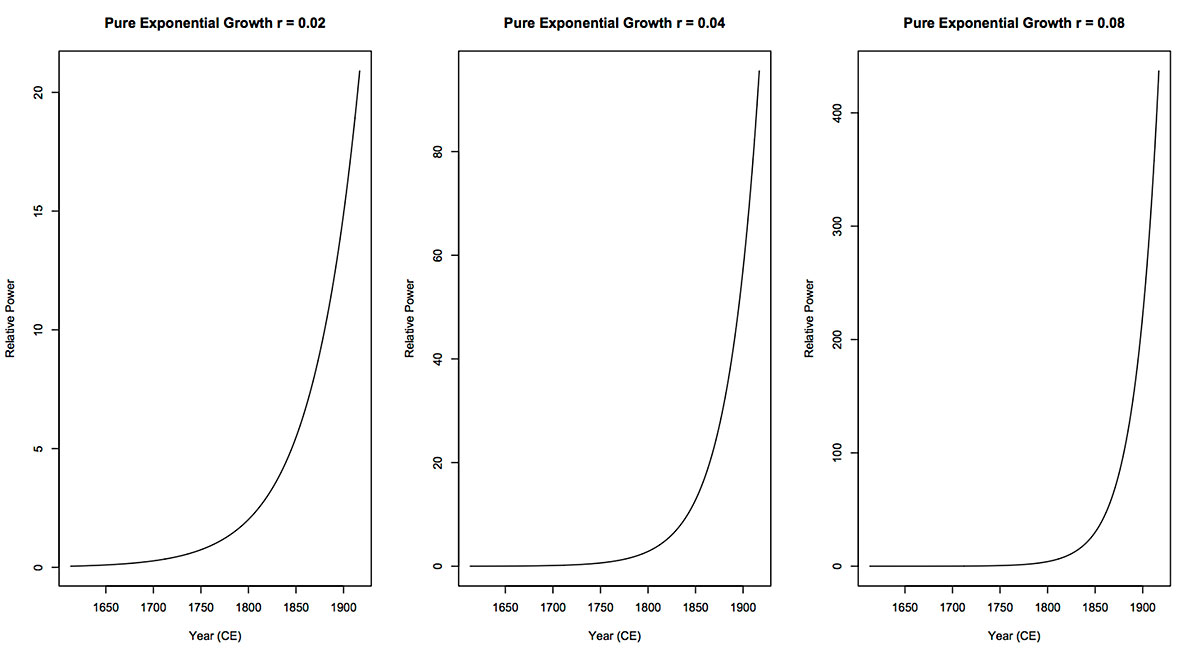
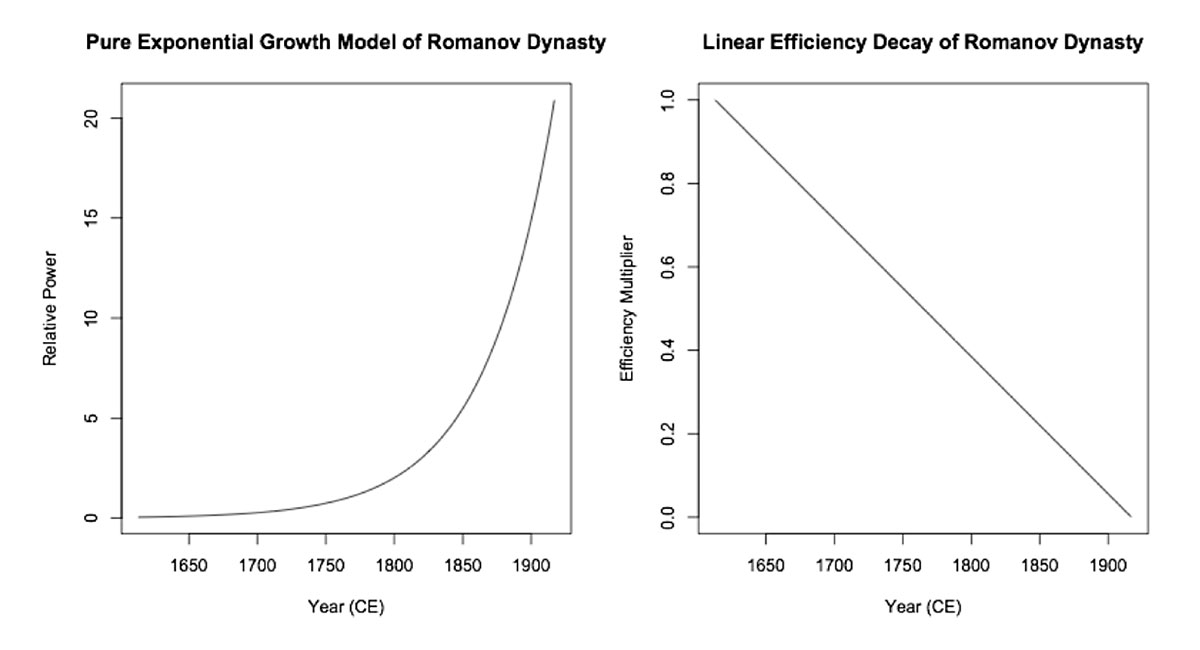
Petroleum extraction represents an especially interesting case, because energy is literally being extracted. For a dynasty (or modern government) substantially dependent upon petroleum for its energy and economy, the rate of net petroleum production versus time is its power progression (in physics, power is the rate of energy expended per unit of time). Net production means the total energy extracted less the energy required for production operations. Emergence and Progression of a Single Dynasty We will now express historical dynasties as emergent dissipative structures, and generate power progression models of dynasties from fundamental principles. In this discussion, the term dynasty is used broadly to refer to a continuous ruling group; it could be a related family but not necessarily so. In contrast, the term society will refer to a large group of related people, typically of a single or similar group of ethnicities, such as the Han people in China or the Frankish people in France. Dynasties exist within a society, but can conquer other societies as well. For example, the society of Russian people produced a series of dynasties, and those dynasties sometimes conquered other societies. Dynasties as Bubbles. Both physical and social built-up potential can drive the formation of dynasties. Within the context of a civilization progressing over centuries, it is often possible to degrade built-up potential even more quickly with high-level, governing social structures for a society. Hence, dynasties form to accelerate consumption of such potential. Hypothetically, dynasties should result in more rapid degradation of energy than does a more static society. Each dynasty has a lifecycle. A dynasty is born, matures, endures awhile, then ends. A new dynasty will not necessarily follow an old one, or might not immediately appear. Yet generally, dynasties continue to form, one after another, so long as there exists built-up potential that cannot be more quickly consumed by other means. The dynastic lifecycle can be described as a march towards equilibrium in terms of nonrenewable resources, and towards dynamic equilibrium in terms of on-going flows such as sunlight and rainfall. We can consider large, independent, robust dynasties to be bubbles. A new dynasty within a society encounters a built-up potential of physical and social resources (e.g. goodwill), albeit of limited magnitude. The society governed by the dynasty fills the role of a collection of heat engines, producing both work and entropy. Prosperity expands exponentially, increasing the consumption of potential exponentially. Eventually, it becomes increasingly difficult for the dynasty to rely upon its store of physical and social resources, decreasing its efficiency. As efficiency decreases, the dynasty will experience social crises and will eventually stop functioning. Considerations for Modeling Dynasties. It is simpler to model a sufficiently large, robust, independent dynasty than one that existed merely at the whim of its neighbors, for there are less significant dependencies, and thus it can be approximated as a substantially isolated system. We will examine Russia's Romanov dynasty as an example. Widely accepted start and end dates are 1613 and 1917.19 Peter the Great and Catherine the Great were the two important rulers of the Romanov dynasty, and the Russian Empire gained much of its most valuable territory by the end of Catherine's reign in 1796. The Romanov dynasty was big, robust and essentially independent. It fought wars, but generally was not under serious threat of extinction. Even Napoleon could not conquer Russia. This Romanov dynasty was reasonably long-lived, rather than just a quick, "flash-in-the-pan" empire. By developing a fundamental approach to modeling the rise and fall of dynasties, it is possible to accept or reject models (within a range of uncertainty) based upon both qualitative historical evidence and quantitative historical data. We shall discuss generating models of the rise and fall of power of dynasties versus time and how a single dynasty can be modeled using the efficiency-discounted exponential growth (EDEG) approach.20 Such an EDEG model of a dynasty can be called a power progression. The models shown should be considered mere first approximations rather than definitive assertions of fact. They are a beginning point of further explorations. Historical dynasties are consumers of energy and producers of power, so models in terms of such quantities are inherently fundamental in that they can be derived directly from the laws of physics and expressed in physical quantities. Such models are not theories of everything, but rather describe certain aspects of broad macro-historical phenomena rather than the intricate workings of the interactions of individual people. The term energy is meant in the physical sense here. There are several possible proxies of the physical energy of a dynasty, such as population governed or grain production. Each of these is translatable into physical units of energy. For example, the quantity of people multiplied by the mean Calorie diet per person will result in units of energy. These figures can be estimated for most dynasties over their lifespans, albeit with differing degrees of uncertainty. The proportion of that energy that rulers of a dynasty effectively have at their disposal is beyond the scope of this paper, but should be considered for improved accuracy. Power is a physical term. It refers to energy expended per unit of time. Yet it also has meaning within social and political contexts, and will be discussed in both senses. Absolute power would generally be presented in physical units of power such as Watts. However, it is possible to express any type of power in terms of proportions, such as the ratio of power at a dynasty's peak to its start date. Such a ratio can apply to physical, political or even military power. Possibly, the EDEG approach can be utilized to model other types of power, such as political power. In fact, the EDEG approach provides a framework to explore the question of how political and physical power are related. Exponential Growth of Dynasties. A new dynasty will tend to experience exponential growth. A chief characteristic of exponential growth is that growth feeds even more growth, resulting in an increasing rate of growth. Increases in population and power can become explosive. Nevertheless, the growth rate in early stages tends to be relatively flat, while the growth rate later tends to be relatively steep. The transition between "flat" and "steep" can be surprisingly sudden and disruptive.21 It will be assumed that dynasties will strive to grow exponentially. (This paper does not attempt to prove this assertion, but rather it is a rebuttable presumption). If so, this certainly explains the rise of a dynasty. Sources of growth can include increased agricultural productivity, geographic expansion, and trade expansion. The Romanov dynasty is shown with various growth rate models (Figure 4). The plot shapes appear similar, except that a greater rate produces a "sharper" corner. Also, notice the range of power values: a greater growth rate produces a disproportionately greater power value at later points of time. The growth rate function can be constrained by the data and an understanding of the growth mechanisms involved.
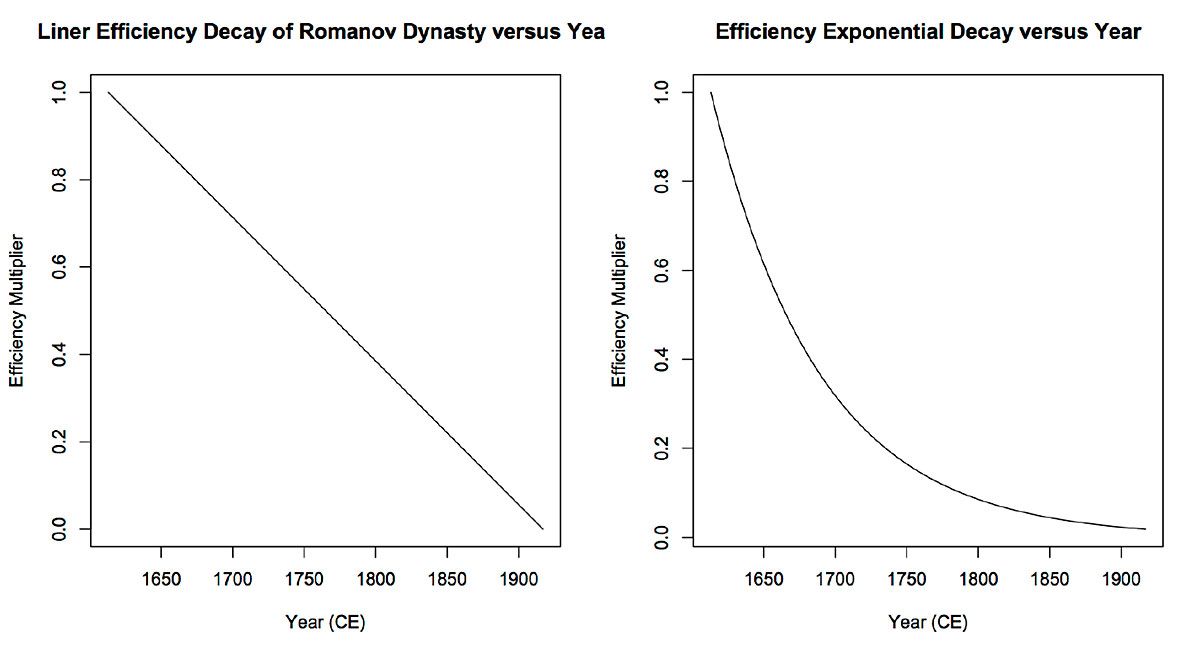
Limiting Factors and Decreasing Efficiency. Another source of limiting factors is the increasing cost-per-unit to extract nonrenewable resources such as minerals. Societies attempt to use large-scale social and technical structures to shore up efficiency (e.g. San Juans mining case study), but these structures create additional challenges. There are other examples. In the U.S., the "closing" of the western frontier marked a limit of growth to homesteading. In petroleum production, the increasing cost of drilling for oil is a limit to growth. Malthus22 pointed out limiting factors in the growth of agricultural production. A dynasty will typically consume both conserved and renewable resources. Yet it is the consumption of one or more critical nonrenewable resources that determines the growth and decline characteristics of the regime. Production in a dynasty is ultimately dependent upon nonrenewable physical and social resources (otherwise dynasties would not typically end). Dynasties inevitably do end, which is typically preceded by a decline in power. As the dynasty progresses, nonrenewable resources will be consumed, and efficiency will decrease. There will still be production until the end, but there will be a lower return on investment, so to speak. Physical causes of decay can include overuse of agricultural land leading to nutrient depletion, the build-up of toxins in the environment, and the depletion of old growth forests. Social causes can include running low on social goodwill, the increased dependency on expensive, monopolistic centralized institutions and structures, and the resulting decreased accountability of aristocratic "deadwood". All such may have nonrenewable aspects. The key impact of limiting factors, whether insufficient positive resources or excessive negative resources, is a decrease in the efficiency of whatever is acting as "heat engines" to do work. There are two types of decay, linear and exponential. Examples are compared (Figure 5). Note that efficiency here is shown as a proportion (multiply by 100 to get a percentage).
Exponential decline in an EDEG situation can happen more quickly than exponential growth. However, there are two disadvantages of exponential decay within the context of modeling dynasties. First, it is more difficult to set up. For example, exponential decay has an infinitely long tail. While this allows for mathematical immortality, most of the tail is superfluous in the context of a dynasty of limited lifetime. Second, it may not provide the most consistent models with observations, since there can be multiple sources of efficiency decline with differing functions. A linear approach is simpler to set up. Importantly, it also provides some reflection of overall efficiencies achieved through centralization and economies of scale as the dynasty progresses. Centralization can produce economies of scale that can boost net efficiency, but when a centralized system eventually goes bad, it can go bad fast! Failed central institutions can bring a dynasty crashing down quickly. This is an example of an irreversible process. A linear approach has unambiguous beginning and end points. Efficiency cannot be greater than 100%, and is typically not lower than zero. Therefore, as a first approximation, one can set the overall efficiency to 100% at the start date of the dynasty and 0% at the end year (except that the math is simpler if the value 1 is used for 100%). Although physical efficiency is typically lower than 100% for real life heat engines, 1 provides an easy starting point that also produces the correct shape of curve. (It can be adjusted based on the nature of the power source). Using a value of 0 for ending efficiency ensures that the dynasty ends by its historical end date. It is possible to use a value other than zero for the ending efficiency, but then some other factor must be used to end the dynasty. The following is an example of linear decay function:
As the year increases, efficiency will decrease. Using a lower initial efficiency reduces the magnitude of production increase for the dynasty compared to its initial production. It also flattens out the curve. Generating A Dynastic Power Progression. We now bring exponential growth and declining efficiency together (Figure 6).
Growth will not only slow down but often will start to reverse. Such growth and decline can be represented by an EDEG function, where the area under the curve represents either the total production or consumption of a conserved resource over time. Note that the critical resource becomes more expensive as each successive unit of it is utilized. In the case of petroleum or a precious ore, the least expensive deposits are extracted first. Then the next least expensive deposits are extracted and so on. The following is an example of an EDEG equation:
Here is a simple way to generate a quantitative model for a dynasty. It is simplistic, but it generally produces qualitatively correct results. Assume exponential growth:
Where P is power, P0 is initial power, t is time and k is a growth factor. Assume that a nonrenewable resource is being consumed that cannot be replaced within the lifetime of the dynasty. Then assume the efficiency of each subsequent unit of resource consumed produces power as a decreasing efficiency. Using the simple linear efficiency decay function from above:
where e is efficiency. Then the efficiency-discounted power is:
Substituting in our functions (utilizing linear decay):
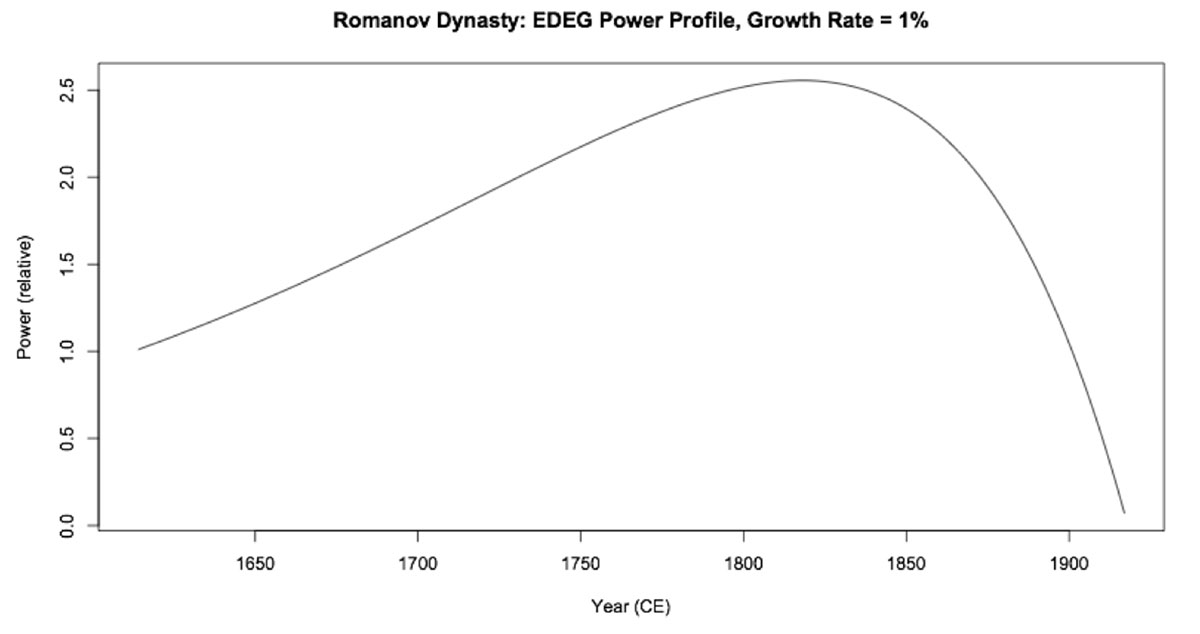
This produces a steady rise, a level period and a slightly faster decay. By discounting exponential growth by decreasing efficiency, we then have a rise and fall pattern that is consistent with the rise and fall of a dynasty. Let us assume a conservative 1% growth rate for the Romanov dynasty. Let us further assume linear decay from 100% to 0% efficiency. A simulation has been written in the Ruby programming language. This language is mathematically robust, yet involves code that is relatively easy to read and understand. The dynasty is run through the Ruby simulator, using the above parameters. The R program was utilized to generate a plot of the results (Figure 7).
Here the peak is close to 1820. Napoleon had been conquered, and the dynasty had achieved much of its geographic expansion by then. Yet by this time, social unrest began to shake the Romanov dynasty. Also, note how the dynasty power begins at a level of 1 and ends at a level of 0. This is conceptually appropriate, since the dynasty had to begin from something, but typically ends in nothing. (Actual power quantities can be used, but their explanation is beyond the scope of this paper). For example, the ancestors of the Romanovs existed before 1613, but the entire immediate family was killed during the Russian revolution. The peak occurs at a relative power value of height of 2.6, which indicates that the dynasty was over twice as powerful at its peak as it its beginning. Remember, this model is merely a hypothesis that is either valid or not for a particular level of uncertainty. Note that utilizing a higher growth rate results in a later peak. Also, the total peak to initial power ratio skyrockets as the growth rate is increased. Additional factors can be imposed as adjustment functions. One-time events (such as a rare but large natural disaster) can be superimposed as an event "mask". It may be of further interest to tie the rise and fall to patterns concerning the production and consumption of resources, to determine what correspondence, if any, there is between physical and political power. This can be explored by utilizing actual physical energy data to produce a model of physical power, and then comparing that model with evidence of political power over time. With the wealth of historical data being gathered in anthropological data warehouses, and other "big data" facilities, this may be accomplished with increasing validity. Narrative Description of Generic Dynastic Progression. We can use the EDEG approach to describe anecdotally the lifecycle of a major dynasty (e.g. China, France, West Africa). It would typically begin with a daring, competent, often unpolished leader, but with effective power loosely distributed. Chaos becomes order and economic production rises. Yet, future generations of rulers will become increasingly desirous of luxurious living and will also demand expensive "trophies" such as palaces, major public works or optional conquests. This will stress the resources of that society, and the dynasty will experience financial difficulty. Initially, centralization will be used to increase overall efficiency, but at the expense of decreasing individual initiative and decreased ruling class accountability. Eventually, taxes will be need to be increased. Bureaucracy will need to be greatly expanded to collect increased taxes. Internal dissatisfaction will increase, so greater internal military effort will be required to suppress rebellions. Dynasty rulers will become increasingly dependent upon their military to maintain internal order and to enforce tax collection. Meanwhile, the rulers will tend to become increasingly occupied with court etiquette and pursuit of "civilized" activities as art and scholarship; but they will become less competent at governance and further removed from the realities of the population they govern. A large, hungry population and bureaucracy has formed that cannot be downsized without considerable disruption (overshoot). Eventually competing figures from within the society will challenge the rulers. These initial challenges will be put down often brutally, further increasing discontent, and destroying much of the social structure and institutions required for the effective maintenance and defense of the society and its economy. Due to the chaos and decreasing magnitude of economic activity, the population and its strain on natural resources will decline, allowing for some recovery of productive capabilities and once again the build-up of potential. Nevertheless, it is too late for the dynasty. Further challenges from either within or without the society will replace the dynasty, and a new dynasty will form. Must a dynasty have a life cycle? Could it not last forever, or at least indefinitely? Societies, religions and some other institutions can last much longer than dynasties. It is conceivable that a dynasty could be managed in a sustainable manner, but this is not what we typically observe in history. Series of dynasties A society can be modeled as a series of dynasties or EDEG bubbles. Each bubble would typically represent a dynasty for a traditional historic monarchy. Robust, traditional, monarchical, agricultural-based regimes have historically tended to endure for roughly 300 years. This is an empirical observation and not based upon theory. Not all regimes last for about 300 years. Yet the 300-year pattern has appeared frequently in history from France to China to West Africa. We will focus on dynasties that endure for about that time. A common error would be to assume that the series of EDEG curves represents a periodic function. It's not. Dynasties might not follow immediately one after another. Not all dynasties last the same amount of time. Or there could be some overlap between older and newer regimes. Dynasties in major historical civilizations are typically easy to identify. In a sense, dynasties are what fill the pages of historical textbooks. A series of power progression models of Russian dynasties is plotted (Figure 8). Although the plots are each set to a maximum power of one, actual power would vary among dynasties.
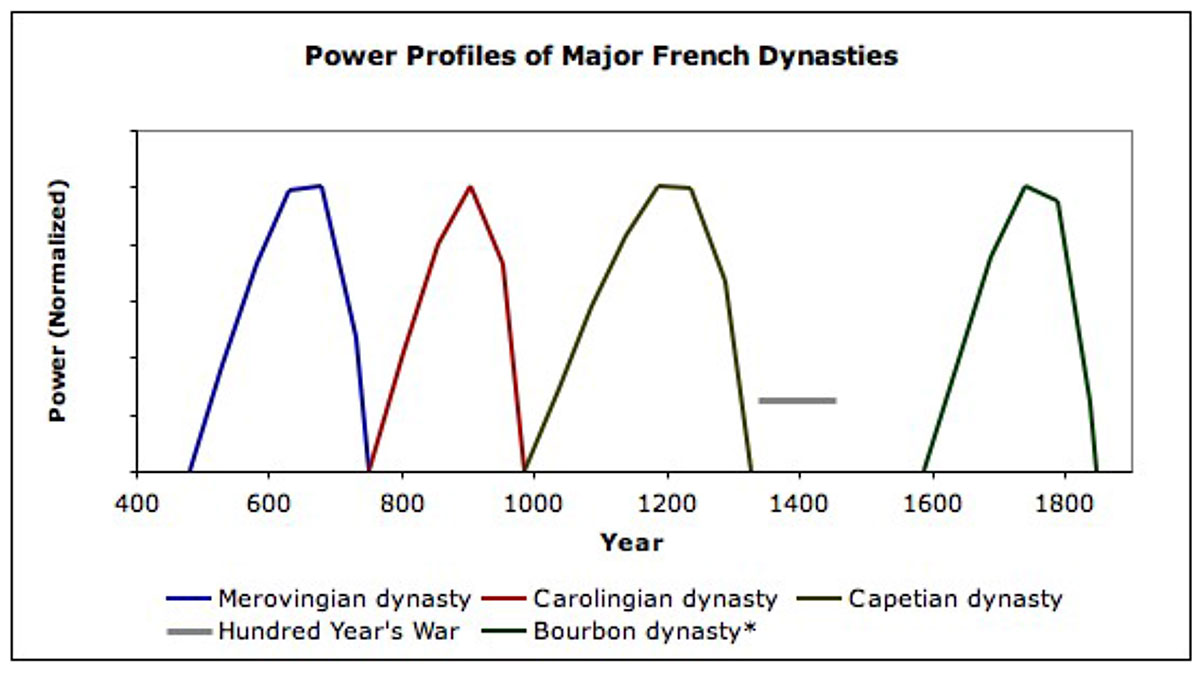
Table 1 presents a chronological list of French dynasties, along with duration data. The real picture is not quite as neat as the table suggests, but there were several distinct dynasties. Clearly, dynasties are not precisely periodic, as their length somewhat varies. Dynasty start and end dates are typically from Mazour and Peoples (1975). The results are plotted (Figure 9). TABLE 1: Dynasty Series for France
Table 2 shows a chronological list of several major West African dynasties, along the Niger River, from 750 CE to 1591 CE. TABLE 2: Dynasty Series for West Africa Niger River Region
Power progressions for them have been plotted (Figure 10). The lack of periodicity is more obvious. Although the geographic locations were all in West Africa, the exact locations varied. There was less territorial overlap than in the French dynasties presented.
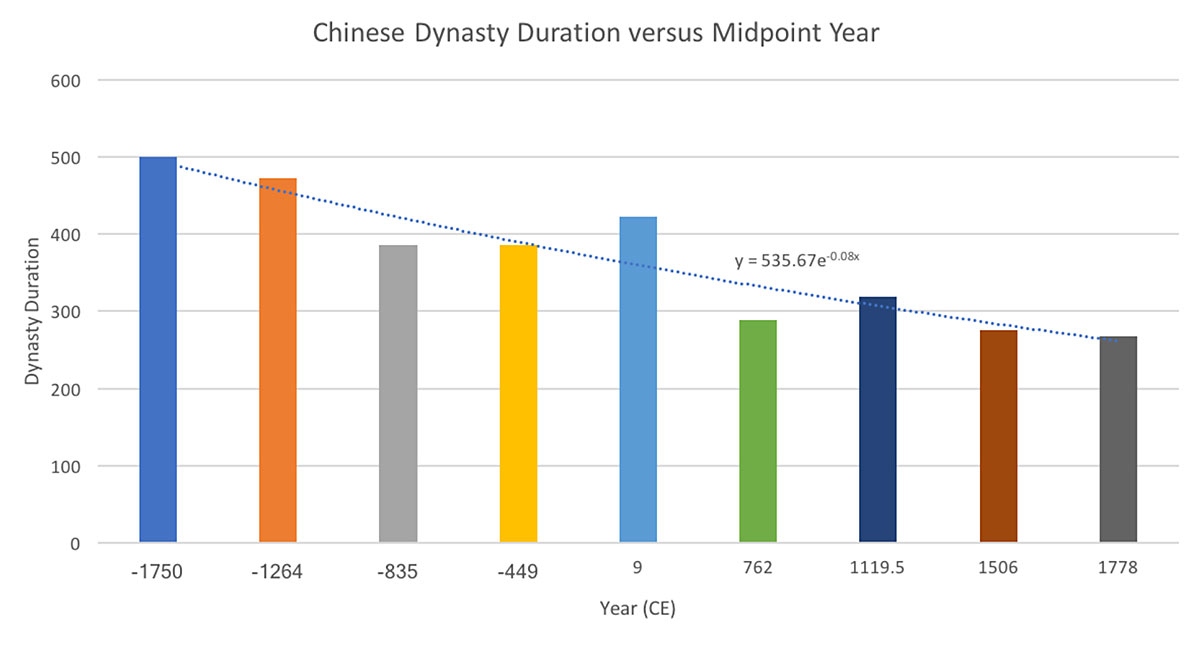
The longest series of dynasties for a single region and people is that of the Han people in China, shown in Table 3. TABLE 3: Major Traditional Regime Series for China
* Chou dynasty became essentially symbolic by about 700 BC, and China was chiefly ruled by small states during this symbolic "second" Chou dynasty. The duration of major Chinese dynasties versus their midpoint dates has been plotted (Figure 11). There might have been an exponential decay trend in the duration of major Chinese dynasties over time.
Disclaimer: this example only applies to history preceding 1911. Regimes since 1911 may have fundamental characteristics that are different from those of traditional regimes. This same disclaimer could apply to most other contemporary societies as well. There are two main approaches to generating a series of dynasties. One approach is to generate a model for each dynasty separately, and then combine the simulation results for a combined period. A second, more insightful approach is to model potential as an ongoing flow versus a resisting tendency, so that a series of logjams and bubbles are created. This allows for some resource replenishment. The challenge is to do so with as few parameters as possible. While the second approach has been tested, only the first approach is used in this paper. The power progressions shown were normalized. However, one dynasty in a series might be more powerful than another. There are several ways to express changing power. For example, later dynasties might have more power than preceding ones due to greater population or energy technologies (animals, windmills, agricultural improvements). However, the relative power of a series of dynasties compared to nearby dynasties could vary as well. A society may face differing levels of competition from neighbors. Interacting Dynasties A EDEG function can be a robust entity, but it can still be affected by simultaneous or co-existing dynasties or even overwhelmed. Potentials can exist between dynasties (generalized as regimes here), such as in the case where one regime has a persistent trade surplus with a co-existing regime. Only something out of a science fiction movie could have eliminated either the Roman Empire or the Chinese Tang dynasty at their heights. The power profiles for the very largest human regimes in history will be largely independent of each other. Many smaller regimes are still powerful enough to be fairly robust. However, regimes of small states are highly affected by their neighbors. Likewise, new or dying regimes of larger states lie along portions of their power progressions that are not as robust as middle portions. Such vulnerable regimes may have power profiles that are abruptly terminated rather than gradually terminated. The remaining critical resource of the regime must either be considered to have been discarded, or must be consolidated into the power progression of a conquering regime. Regimes often interact with each other. Therefore, one regime can impact another. This interaction can become quite complicated, especially for smaller regimes. However, the largest, most durable regimes often provide more available data and tend to be somewhat less affected by other regimes, so that the effects are more discernable. To study a system of interacting regimes, it is best to study the greatest series of regimes. China has historically described itself as the central kingdom. Have other historic regimes "orbited" about China as do the planets circle around the Sun in a heliocentric system of astronomy? Is a Sinocentric sociology valid? Yes, but to a limited degree. The mass of the sun is about thousand times greater than that of even the largest planet Jupiter. The social "mass" of China is generally historically larger than that of other societies, but not by such a high proportion, and at times other empires have eclipsed or absorbed China's social "mass." Yet to the extent that there has been any solar equivalent in history, it would be China. Further, the Han people of China have exhibited a series of traditional regimes for a much longer period than any other single society, so it could be argued that it is the closest thing that exists to a historical "clock." Yet perhaps an argument could be made for central Asia being such a clock, since its invasions have frequently affected societies in the continents of Asia, Europe and Africa. What drives the waves of invasions in history of central Asia? Is it a social cause or the build-up of a resource-driven potential? The answer to this question is not well known. When China is ruled by a regime during the strong part of its lifecycle, does this block the Central Asiatic invaders so that their only outset is India, the Middle-East or Europe? The answer to this question depends upon several factors and changes depending on the state of those factors at a given time. Table 4 shows several strong traditional regimes in China and corresponding waves of invasions in Europe. This list is not complete, but is suggestive for several regimes. Dynasty start and end, as well as invasion, dates are typically from Mazour and Peoples (1975). TABLE 4: Asiatic Invasions in European During Selected China Dynasties (CE)
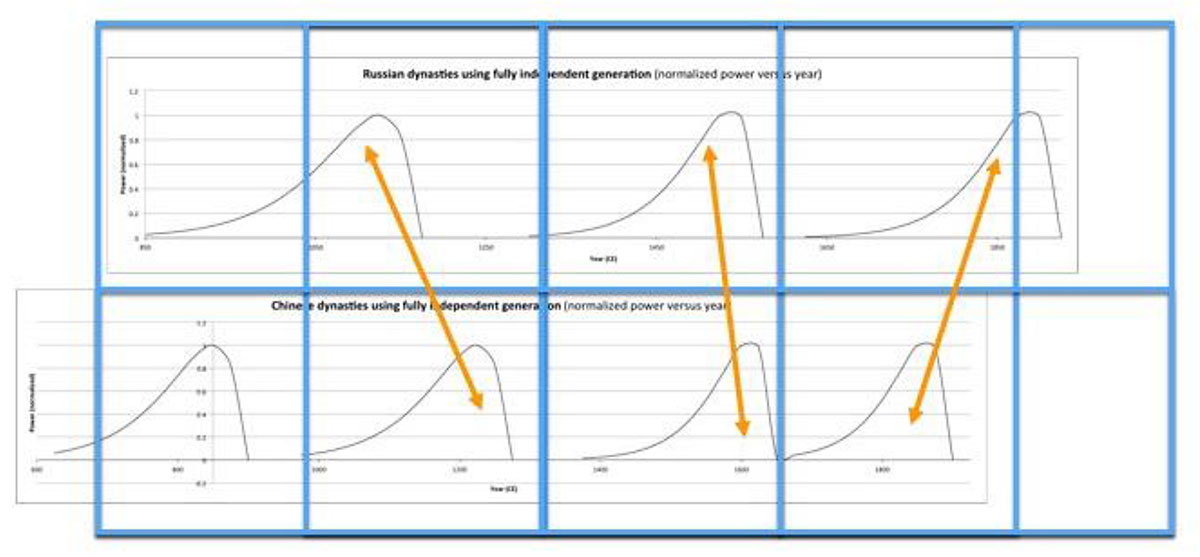
Yet there are exceptions. The Huns, and later the Mongols, overwhelmed both China and much of the West. Conversely, a strong Roman empire might have pushed the Huns eastward before they went Westward, for the Huns attacked China in 317, while they did not invade western Europe until the mid-400s. It could be that the coincidence of strong empires in both the East and the West bottled-up potential in central Asia up to the point that the Huns became extremely potent. That both Russia and China were both relatively strong during the time of the Sung dynasty may have contributed to a build-up of potential in central Asia that helped the Mongols become so powerful. Such speculation should not detract from the achievements of the Mongols such as their innovative battle tactics. Russia is the closest major dynasty-producing region to China. Most barbarian invasions of Europe tended to come through lands at one time ruled by Russia. Therefore, if the rise and fall of Chinese dynasties affects Europe, then Russia (and nearby territory) would be the bridge for these interactions. Are there any patterns between rise and fall patterns in China and Russia? This is examined in "matrix" (Figure 12). Initially Chinese dynasties lag Russian dynasties in their peak. However, the Chinese dynasties are shorter, so the Chinese series finally "jumps" ahead of the Russian series.
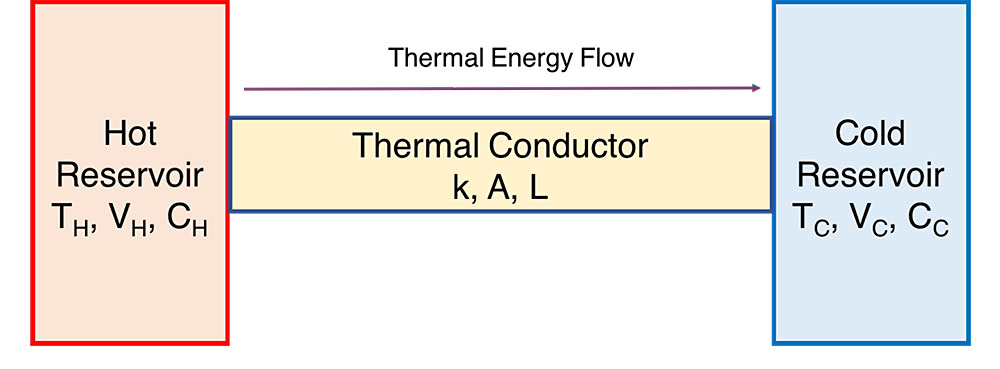
Discussion and Future Directions This discussion of the EDEG approach is more of a barebones beginning than a complete end. It raises more questions than it answers, but it enables a broad framework to answer these questions. This framework acts as a unifying skeleton to link the humanistic elements of history with the quantitative constraints of the physical universe. The power of such a framework should not be underestimated. It is possible to gather quantitative data (or quantify qualitative evidence), perform statistical analysis and accept or reject hypotheses. Yet individually such results, while often important, are merely empirical. They are often hard to use to constrain or illustrate each other. In a unified framework, all results act to constrain all other results. When we learn about one thing, we necessarily learn something about everything else. This is where the physical sciences have derived much of their strength. There are many immediately apparent enhancements to improve the value of the EDEG approach. One improvement would be to better understand efficiency decay. Another improvement would be to start using actual data of physical energy, to the extent such data is available. Another improvement will be to separate the power level of the underlying society from that of the dynasty. For example, Russia did not disappear upon the death of the Romanov dynasty. On the contrary, it is still one of the most powerful societies on Earth. The brings up the need to be able to model the emergence of a series of dynasties in a way that connects and constrains each dynasty, such as concerning relative strength and timing of emergence. Further, there needs to be a way to compare co-existing dynasties and model their interaction within this framework. While the EDEG approach suggests possible means, the devil will be in the details. APPENDIX A Discussion Questions for teachers and Students 1) How accurately can historical quantities be determined? What are sources of uncertainty? How does the path of information from the original recorder to the reader affect its reliability? 2) If a historical entity such as a dynasty ends, must a model of that entity include its end? 3) What is the role of individual initiative in the progression of a dynasty? What is the evidence for your assertions? 4) What are the advantages and disadvantages of a system of governance where dynasties eventually collapse and end? 5) Is every dynasty doomed to end? What does it mean for a dynasty to end? 6) What would it take to overcome the challenges that cause the end of the type of dynasties discussed in the paper? 7) Numerous life extension technologies for human bodies have been proposed that might allow people to live forever (or many thousands of years). What types of approaches might be used for "life extension" of dynasties? 8) What role does human psychology play in the progression of dynasties? Does the physiological state of a population change during the progression of a dynasty? How so? 9) Can Maslow’s hierarchy be utilized as a classification system for psychological transitions during the progression of a dynasty? 10) How does this paper make you feel? How will it affect your own actions in the future? APPENDIX B Terms and Their Definitions Several terms will be defined below and related to each other. These terms may sound familiar, but here they may be defined independently of their use in other fields. These terms are intentionally general, yet pertain to specific types of phenomena. Tendencies, Potentials, Flows and Bubbles. A tendency is something with a greater than random likelihood of happening. Forces are tendencies. For example, gravitational force is a tendency for massive objects to accelerate towards each other. The term force has a specific meaning in physics, whereas the term tendency is broader and more inclusive. Not all tendencies are forces. Equilibrium represents a state of a system in which tendencies can no longer cause any change. When a system has reached equilibrium, it is literally dead. (In contrast, dynamic equilibrium is when a rate of something remains constant, where tendencies offset each other to produce a steady flow). Potential represents the ability of a system to achieve something. A potential is typically the result of a system being pulled away from equilibrium with respect to a tendency. For example, when a spring is stretched, it tends to return to its original length. That spring has stored potential energy. If the spring is released, it will move back towards its equilibrium position. When systems release or consume their potential over time, a flow occurs. In some cases, a flow comprises the transport of a physical element such as water or energy. In other cases, a flow may represent an ongoing change in an abstract quantity such as money. For example, imagine that snow falls on a mountain in winter. The mass of that snow has been raised well above sea level. The material of the snow has gravitational potential. When summer arrives and the snow slowly melts, a steady flow of water will trickle down from the mountains, and travel through rivers back to the sea. As the snow water slowly moves downhill, its gravitational potential is consumed. The water has achieved its "goal" of returning to equilibrium with respect to gravity. Sometimes rivers get blocked, such as from falling trees. Additional flotsam piles up, forming a logjam, blocking the flow of water. More and more water will accumulate behind the logjam, creating increasingly greater force. When the force exceeds that which the logjam can resist, the water will break apart the logjam and flow at an accelerated rate until it transitions back to its usual rate (dynamic equilibrium). This situation is similar to blowing up a balloon with more and more air, until the material is stretched to its breaking point and bursts. These are examples of simple bubbles. Thermodynamic Tendencies and Drivers. Thermodynamics is a branch of physics that concerns the flow of thermal energy (heat) and the ability to convert energy into work. Thermodynamics is extensively used in atmospheric science, biology, chemistry, engineering and geology. A key motivation for development of thermodynamics as a discipline was to understand how to make engines more efficient, and what could be the maximum efficiency for engines. Another motivation was to express the energy involved in chemical reactions. There is a tendency in systems for thermal energy to evenly distribute itself in a manner that temperature becomes equal for all regions in a system. Sometimes this is called an entropic force. When regions in a system differ in temperature, a thermodynamic potential exists. If those regions are bridged by a thermal conductor, then thermal energy will flow from hot to cold regions (see Figure 13).23 As thermal energy flows, potential is consumed. Thermal energy will continue to flow until both regions possess the same temperature. At this point, those regions are said to be in thermal equilibrium.
Chemical and pressure differences also involve thermodynamic tendencies that can result in flows and the consumption of potential. Humans are biological organisms involving chemical reactions. Humans use engines and other energy-consuming technology. Hence, it should be no surprise that the laws of thermodynamics provide a driver and set of constraints that act upon human systems. Entropy, Reproducing Engines and Exponential Growth. A quantity called entropy increases as all real systems progress though time. For systems involving a nonrenewable resource, entropy is the ultimate accounting tool. A real-life system can remain active so long as it can produce entropy. When it can no longer produce entropy, it cannot change in a meaningful way. It is essentially dead. A bubble inherently involves a resource that is nonrenewable within relevant time frames. Therefore, a full accounting of entropy can express the state of the system with regards to how far it is along an irreversible process. Entropy has a precise definition in physics: it is the log of a quantity called multiplicity, multiplied by a constant number (Boltzmann's constant). Informally, entropy is a measure of how evened-out things are, such as when thermal energy flows to even out temperature differences. When thermal potential gets consumed by a conductor, the entropy of the system increases. While a system produces entropy, it is alive, at least in some sense. Biological organisms produce entropy, so they are alive, in both this and the traditional sense. APPENDIX C Derivation of the Efficiency-Discounted Exponential Growth Model An EDEG model was generated for U.S. domestic petroleum extraction. Oil shale is a much different material from crude and has not been included. Actual data exceeds model prior and after peak. Parameters were set to match peak, but could have been adjusted for less error elsewhere at the expense of greater peak error. We start to model a Hewett-Hubbert (HH) curve by using a pure exponential growth function, representing output versus time. Let us call production P, and time t, so that
Such a function will quickly grow and approach infinity. However, in the case of HH curves, there are limiting factors such as the accessible amount of the nonrenewable resource in the ground, as well as increasing average effort needed to acquire each additional unit of production. The rising rate of additional effort required (on average) to produce each additional unit represents decreasing efficiency. So, we need to discount pure exponential growth by this decreasing efficiency by multiplying the exponential growth function by an efficiency function. If we call efficiency ε, where ε is a function of time, then
In this context, the term "accessible" refers to the amount of the resource that can be extracted using technology and other means that available either at present or during the period of exploitation. There are additional factors (called parameters or constants), but we need not consider those for this paper. Often, they need to be determined empirically. A rough, baseline approach to model efficiency is to divide cumulative production by the original total amount of resource (i.e. total possible production) and subtract the result from one, resulting in linear efficiency decay. For example, if the total original amount of the resource is G and the amount produced thus far is F, then the efficiency could be expressed as:
where F is a function of time. We also add an initial condition constant of proportionality k. The resulting equation is a Hewett-Hubbert curve (which is a form of EDEG function):
Mark Ciotola is a Lecturer at San Francisco State University and Curator of the Alexandria Repository at Monash University. His research focuses on using physical approaches to analyze historical processes. This article is based, in part, upon presentations at the World History Association Annual Meetings in Ghent, Belgium in 2016 and Boston, USA in 2017. His email is ciotola@sfsu.edu. |
||||||||||||||||||||||||||||||||||||||||||||||||||||||||||||||||||||||||||||||||||||||||||||||||||||||||||||||||||||||||||||||||||||||||||||||||||||||||||||||||||||||||||||||||||||||||||||||||||||||||||||||||||||||||||||||||||||||||||||||||||||||
|
|
||||||||||||||||||||||||||||||||||||||||||||||||||||||||||||||||||||||||||||||||||||||||||||||||||||||||||||||||||||||||||||||||||||||||||||||||||||||||||||||||||||||||||||||||||||||||||||||||||||||||||||||||||||||||||||||||||||||||||||||||||||||
|
Notes
1 Arto Annila and Stanley Salthe, "Physical foundations of evolutionary theory," J. Non-Equilib. Thermodyn. 35 (2010), 301-321. 2 Mark Ciotola, "Factors Affecting Calculation of L," Kingsley, S., R. Bhathal, ed.s, Conference Proceedings 4273 (International Society for Optical Engineering (SPIE), 2001). 3 Fred Spier, "Big History: The Emergence of an Interdisciplinary Science?," World History Connected 6, no. 3 (2009). 4 Ilya Prigogine, Introduction to Thermodynamics of Irreversible Processes (New York: Wiley, 1967), 67. 5 Bradley Carroll and Dale Ostlie, An Introduction to Modern Astrophysics, 2nd Ed. (Pearson Addison-Wesley, 2007), 316. 6 Dennis Meadows, Donella Meadows, Jorgen Randers and William Behrens III, Limits to Growth, Club of Rome (New York: Universe Books, 1972). 7 Michael Butler, Animal Cell Culture and Technology (Oxford: IRL Press at Oxford University Press, 1996). 8 Clyde Henderson, Mining in Colorado: A History of Discovery, Development and Production, Professional Paper 138 (Washington: U.S. Geological Survey, U.S. Department of the Interior, 1926). 9 Duane A. Smith, Song of the Drill and Hammer: The Colorado San Juans, 1860-1914 (Colorado School of Mines Press, 1982). 10 Eric Twitty, Mining Resources of San Juan County (Lafayette, CO: National Parks Service, U.S. Department of the Interior, 2010). 11 Smith, 1982. 12 Smith, 1982, Twitty, 2010. 13 Ciotola, "Effects Upon the Progression of a Society and Its Business Structures Due to Dependency Upon a Nonrenewable Resource: The San Juan Mining Region", Richard Robinson Business History Workshop 2016-Business and Environment in History: Dealing in Nature and Ecology, Pasts and Futures Portland State University 28-30 April 2016 14 Richard E. Chapman, Oil Geology (Amsterdam: Elsevier, 1983). 15 Kenneth S. Deffeyes, Hubbert's Peak (Princeton: Princeton University Press, 2001). 16 Marion King Hubbert, "Energy from Fossil Fuels," Science Vol. 109 (1947). 17 Ibid., Nuclear Energy And The Fossil Fuels, Publication 95 (Houston, TX: Shell Development Company, 1956). 18 Ciotola, Modeling US Petroleum Production Using Standard and Discounted Exponential Growth Approaches (2010). 19 Anatole Griaorevich Mazour and J. M. Peoples, Men and Nations, A World History, 3rd Ed. (New York: Harcourt, Brace, Jovanovich 1975). 20 Ciotola, ArXiv, "Efficiency Discounted Exponential Growth (EDEG) Approach to Modeling the Power Progression of a Historical Dynasty," submitted on 18 Nov 2014 (2014) 21 Meadows et al., Limits to Growth, Club of Rome (Universe Books, New York 1972). 22 Robert L. Heilbroner, The Worldly Philosophers 5th Ed. (Touchstone (Simon and Schuster), 1980). 23 Daniel V. Schroeder, Introduction to Thermal Physics (San Francisco: Addison Wesley Longman, 2000). |
||||||||||||||||||||||||||||||||||||||||||||||||||||||||||||||||||||||||||||||||||||||||||||||||||||||||||||||||||||||||||||||||||||||||||||||||||||||||||||||||||||||||||||||||||||||||||||||||||||||||||||||||||||||||||||||||||||||||||||||||||||||
|
|
| Home | List Journal Issues | Table of Contents |
| © 2018 by the Board of Trustees of the University of Illinois |
Content in World History Connected is intended for personal, noncommercial use only. You may not reproduce, publish, distribute, transmit, participate in the transfer or sale of, modify, create derivative works from, display, or in any way exploit the World History Connected database in whole or in part without the written permission of the copyright holder. |